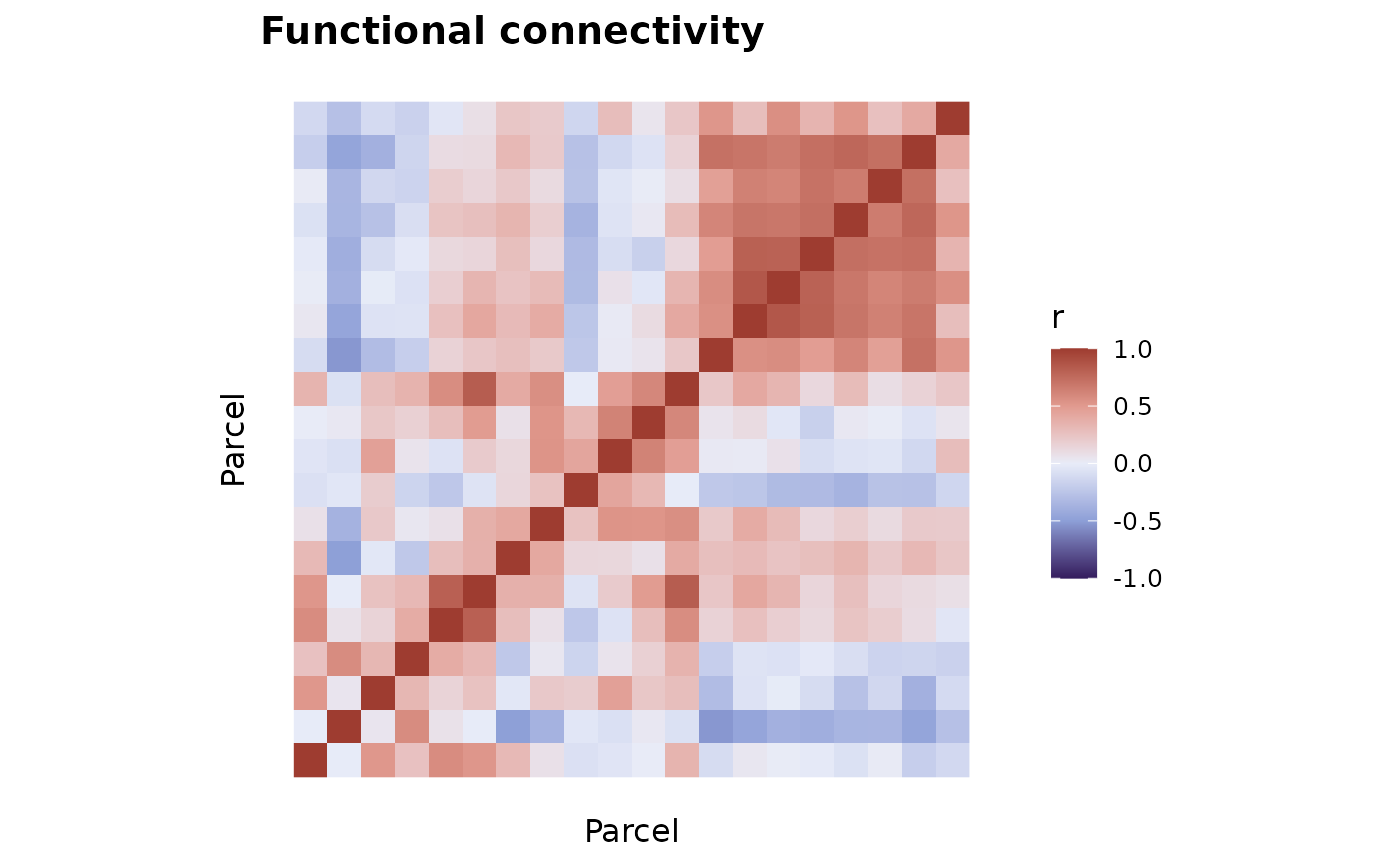
Render a square correlation or phase-locking matrix as a heatmap using the dynR diverging palette (deep indigo -> periwinkle -> brick red), centred at zero. Matches the colour scheme used in the dynR vignettes and pkgdown site.
Usage
plot_fc(fc_matrix, title = "Functional connectivity", limits = c(-1, 1))Examples
data(fc, package = "dynR")
plot_fc(fc[1:20, 1:20])