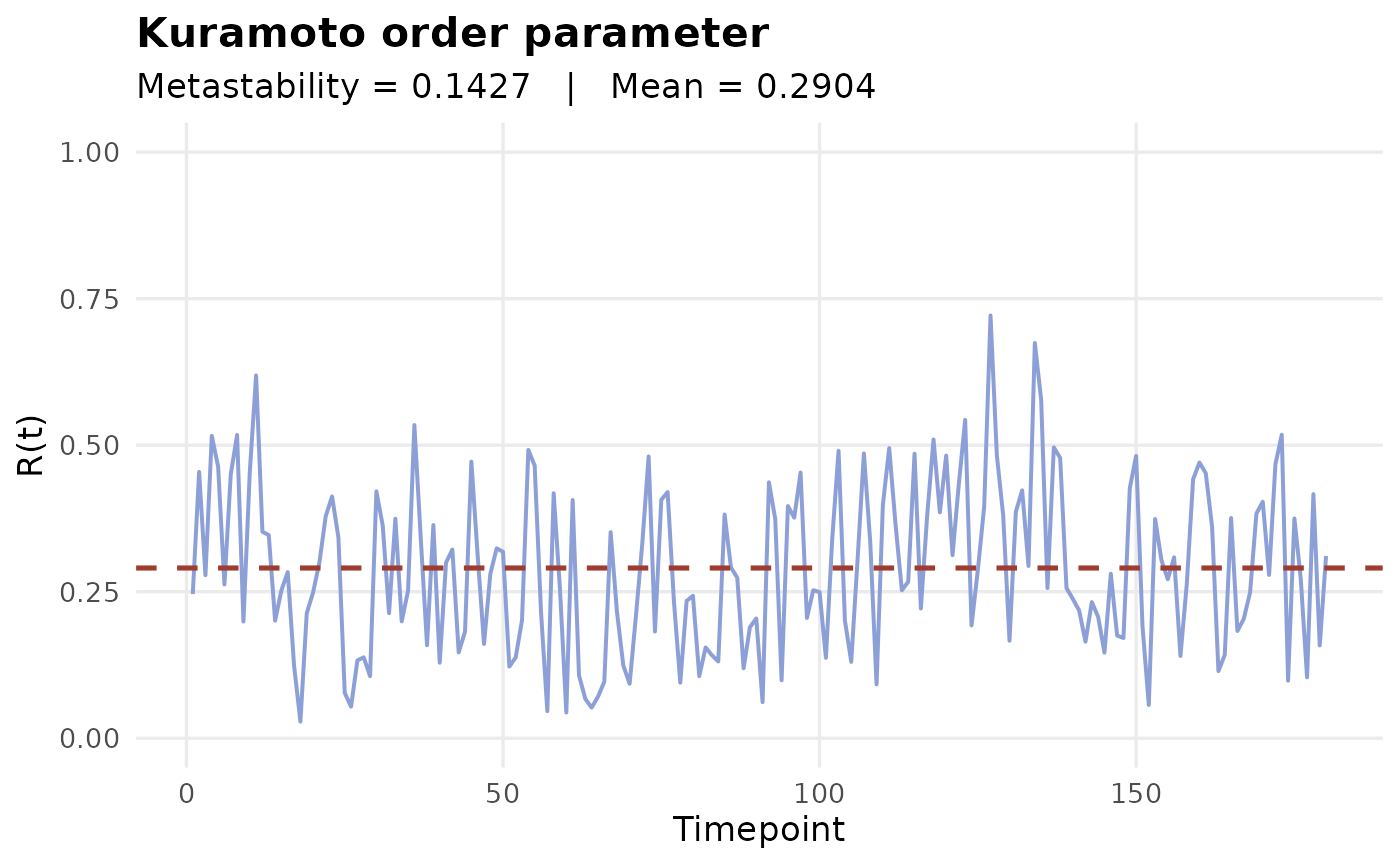
Line plot of the Kuramoto order parameter R(t) over time, with a dashed horizontal line at the mean. Uses the dynR periwinkle/brick-red palette.
Arguments
- synchrony
Numeric vector. Kuramoto R(t), as returned by
kuramoto()or the$synchronyelement ofleida_pipeline().- title
Character. Plot title.
Examples
set.seed(1)
ts <- matrix(rnorm(10 * 200), nrow = 10)
ph  <- hilbert_phases(ts)
kop <- kuramoto(ph)
plot_synchrony(kop$synchrony)